


The three sets of reports to grow your SaaS
How to process information to trigger action

In this post, I attempt to share my learnings on how I developed the sets of reports that provide the real evolution of a company in a way that allows managers to make informed decisions, fast. These reports helped us at Factorial to become a Unicorn by allowing us to understand what was working and what wasn’t, especially in growth.
Before diving into the reports, let’s recall what are the main characteristics of a report:
True: the data that forms a report needs to be as accurate as possible. Finding the source of truth is not always easy. Here it’s especially relevant to make sure data entry and collection are reliable.
Wholistic: a report needs to cover as many data points as possible, without losing focus, as long as it is representative of the health of the business.
Relevance: as mentioned in the previous point, don’t waste energy on vanity metrics.
Consensus: the data included in a report needs to be the same for everyone. It’s more important that the whole organization shares an imperfect set of data than not sharing and not knowing what the source of truth is. There are fewer things more frustrating than being in a meeting and wasting energy discussing the data rather than the decisions to make. So make sure all agents jump into a meeting with the information available beforehand and agreed upon. Without this, avoid the meeting and solve consensus on info.
Availability: a business is not a political chamber. Share the information across the organization so everyone understands the business and knows how to improve it. It also helps to detect flaws. In a business, success is directly correlated with the ability to correct and improve. The bigger the business, the more people need to be involved in those improvements.
Consistency: as mentioned earlier, there are things more important than having the correct data. If you have the right data, but change how to measure it, the indication you are viewing won’t make sense. In companies that are not mature, and which therefore experience a lot of changes, it’s key to analyze a set of metrics over time. If you change the way to evaluate those metrics, those will only fool you. Remember that there’s no perfect benchmark for your company, the closest proxy is your past because it measures your team, your market, your tech, and your moment…, and all of that is unique to you.
Recurrent: it needs to happen recurrently to better analyze cycles and performance.
Actionable: This is the most important. If you create a perfect report but it doesn’t lead to decision-making, you are wasting your time and your report recipient’s time. What makes the difference in a company is the implementation, and implementation is the way managers and employees act.

Having all that in mind, here are the three sets of reports we created at Factorial. I’ll provide an overview of them and dig deeper into them in future posts. Please let me know in the comment section which one you’d like to know more about.
Accounting reports: Profit & Loss Statement (PL), Balance Sheet (BS), and Cash Flow (CF).
SaaS report: the SaaS Masterfile
SAMBA: Sales & Marketing Business Analysis
1 - ACCOUNTING REPORTS
Accounting is the oldest set of reporting created by mankind, and to date is necessary, yet insufficient. Let’s review the three reasons why companies need Accounting:
Tax: It’s mandatory by tax collectors everywhere. To determine how much tax to collect, governments need to know how much you make. Don’t mess with the taxman!
Finance: to get financed, lenders also need to know how is the business going. These reports may vary depending on the sophistication and scope of the lender. If you go to a traditional bank they’ll require some information that you probably don’t use for your business. On the other hand, if you go to a VC to get funding, the analysis they’ll perform will be closer to what you’d do monthly.
Management: this is from my humble point of view, the most important reason. Accounting needs to serve the business. Here’s where most CFOs struggle. It’s not what you got taught in your Big4 days, it’s what the company needs to know.
So, when creating your internal reporting, you need to make sure you can “easily” produce reports to satisfy the needs of the three types of recipients.
Let me quickly describe the 3 basic accounting reports:
Balance Sheet: this is the photo of where the company is at any given moment in time, within a closed period (won’t get into too much accounting here). The problem in SaaS is that a BS does not reflect the full value of a company, hence the big gap between a valuation and a BS. A BS is composed of 2 sides:
Assets: it’s what the company owns. Fixed Assets (mostly the Intellectual Property developed by your Product and Engineering team), Short Term Assets (mostly receivables and inventory for non-SaaS), and Cash. This is an oversimplification.
Liabilities and Equity: this is what the company owes. Liabilities are payments pending to suppliers, creditors, and lenders, while Equity is the theoretical liquidation value for the shareholders. Again, oversimplification.
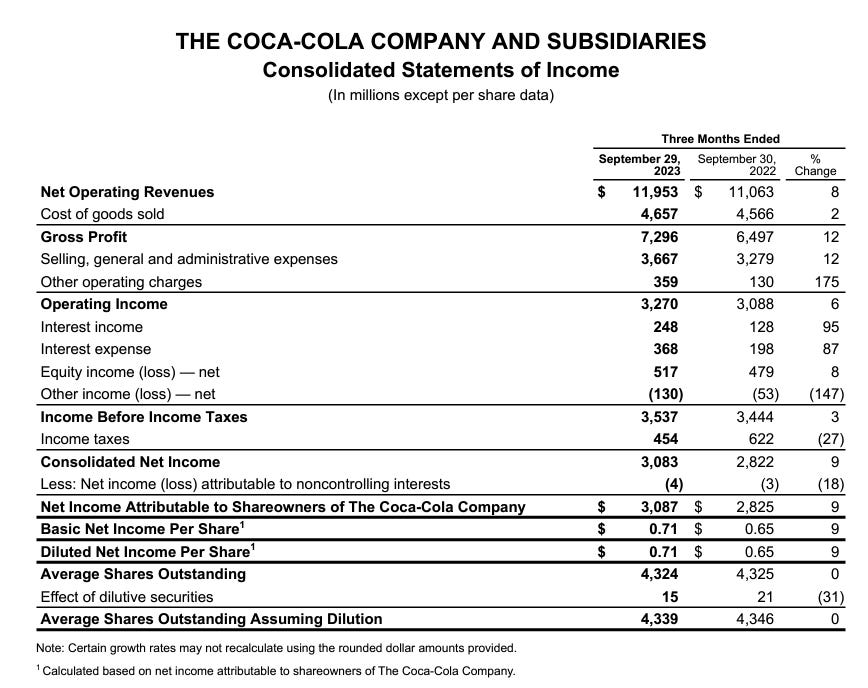
Profit & Loss (aka Income Statement): if a BS was a photo, the PL is the movie between 2 photos. For that reason, it is much more important. If a company has no cash, it’s dead and there’s nothing you can do about it, while if a company doesn’t have a way to eventually obtain a positive PL, it’ll most likely die (there are a few cases where a company can sustain long periods of losses and no external financing, but they are very rare. Governments would be a clear example of that). A company with a good PL will improve its BS as long as they don’t do financial mishaps, which is not allowed in SaaS. Here it’s very important to evaluate the changes in the PL month over month. Below you can see a quarterly PL from The Coca - Coca-Cola Company. As you see, it’s not actionable.

. In my opinion, a good PL needs to have the following structure:
Revenues
COGS (Cost Of Goods Sold): all the costs incurred in the period that are directly related to the revenues. In a SaaS, those can include the Customer Experience team and its tools, the hosting, and the gateway costs (payment gateway, billing platform, and banking fees to collect from clients…). In summary, everything will rise proportionally as you get more clients and therefore more revenue (hopefully).
Gross Profit: this is the monetary value from subtracting the previous two points. Gross Margin will be the same figure put in relative terms, as a %.
Acquisition costs: here you can add any cost related to increasing your revenue. They may include but not be limited to marketing, performance marketing, sales, partners, social… Here I am implying you only acquire demand. If you were to also acquire Supply, those costs should also go in here.
Contribution margin: it’s what you get after subtracting all the acquisition costs from the Gross Profit. It’s called that because it contributes to paying the indirect costs of the company, which come below.
Indirect costs, with each subsection such as Product and Development/Engineering, People, Finance, and G&A (General and Administrative).
EBITDA: the difference between all of the previous subtotals. I like not to capitalize R&D before EBITDA not to fool myself. If you present the PL to a bank, you need your EBITDA to look more black, but if you wanna manage it as close to the cash, you take it out because you want to know how much are you investing each month.
Below EBITDA you can add everything else before taxes, like capitalization, amortization, interest expense, and extraordinary expenses (not accepted by auditors, but life happens).
Cash Flow: as the most important axiom of finance puts it, Cash is King. Companies are ultimately valued for their ability to generate and distribute cash flows to their shareholders. It’s key to analyze a business model’s efficiency regarding its PL. Two different businesses with the same EBITDA may have different Net Incomes because the one with more Working Capital requirements will need to get financed and that will generate interest and may hinder the possibilities to get more financing. That’s why it is paramount to collect asap and pay as late as possible from a financial point of view, maybe not from a business point of view. Having that said, a SaaS is a business where the PL is very close to the CF since collections are mostly immediate (as long as you don’t go upmarket) and the most important expense is personnel, which also needs to be paid monthly.
Cash Balance: this is the cash position you have at any given moment. If you divide the cash balance by the burn rate, which is the cash you are burning monthly, you get your cash runway or RUNWAY. Bear in mind this is a theoretical runway based on the actual burn, which I prefer to calculate as an average for the last three months to reduce the impact of seasonality. However, the real runway is calculated based on the forecast of the business, as it’s highly likely the burn will vary over time. Let’s remember one of the beauties of SaaS is high gross margins, so the more you grow, the better the future cash flows will become, ceteris paribus.
Theoretical Cash Runway (months) = Cash Position / Monthly Cash Burn
In the general scheme of SaaS reporting, I give accounting reporting less than 10% of the value for the whole reporting package. Accounting is a good information source for other reports, but besides the Cash Flow, it’s not representative of your SaaS.
SaaS REPORTING: welcome to the SaaS Masterfile
Cash is the key to survival, but surviving is not the ultimate goal of your SaaS, isn’t it? Let’s analyze how your business is doing, that is, how your clients are behaving. There are multiple metrics you can use to determine if a customer is happy or not. The happiness of your client with your solution is strongly correlated with their loyalty if you don’t have any other defensibility. Nothing speaks happiness like recurrent payments. So let’s analyze how your customers are paying to understand the health of the business.
The SaaS Masterfile is a report that will be required by every VC (Venture Capital investor). If a VC doesn’t ask for that, don’t let them invest in your SaaS as you don’t want someone in your Cap Table who doesn’t understand how SaaS works, do you?
The Masterfile is a spreadsheet that contains a line per every single customer. Before getting dirty, let me differentiate the three types of customer levels:
User: it’s an identifiable person, usually by email, who is unique and belongs to one or several organizations. At factorial, a user is an employee. At Ukio, a user is a guest who has access to an apartment. At Salesforce, a user is a sales rep with a license.
Entity: an entity is the one that pays for the solution. Imagine you have a client that has different instances, once for every country. Let’s say your client is Nestle and they purchase your solution from 2 entities, Nestle Spain and Nestle France. You will need to provide two different invoices, one for each entity, but you only have one client.
Customer/client: A client is the one you acquire, the one that decides to use and pay for your solution. In the previous example, Nestle will be your client. This client will have different entities and probably different subscriptions, depending on your back-office configuration. To better understand your clients and your relationship with them, you need to analyze them by clients, not by subscription, by entity, or by users, which is what all the tools available in the market do. You need to do grandfathering between the subscriptions and the entities and be able to analyze them by client. Here’s why:
We agreed (if you got this far) that the Masterfile will have one line for each client. On that same line, you may add any variable you can later use to segment your data: client ID, name, lead providence, cohort (month), country, market, and product. At Factorial, we also used our approximation to the animal classification based on the famous article by Christopher Janz, but you can use any segmentation that you feel is useful. The animal size was based on the MRR a client had in the last month of the report, so this cell would change every month and we analyzed how the zoo composition was evolving to bigger animals and where to focus our efforts. Then, we would add a new column for every month where we would persist the MRR at the end of that month. It’s important to state that MRR is usually not the same as billing, MRR, or Monthly Recurring Revenue is the amount pretax in your currency that you would bill the client at the last minute of the month if they had a monthly plan. For that reason, the MRR will not match with the revenue from your PL report. You need to audit those differences to make sure you are doing them both correctly, but accept there will always be differences because of billing (an invoice can be issued on a different day with a different number of seats or even pricing plan, the billing cycle may be different and you are not doing revenue recognition to the cent…). By the way, a seat is a unit of billing, as it can be an employee, an event, a GB of data…
That created a set of data that can be analyzed. Here you can see, regardless of billing which can fool you, the evolution of a client. 5 things can happen to every client:
Nothing: MRR is the same as the previous month
Expansion: MRR is greater than that of the previous month. This is of course the desired outcome. It’s the most magical event in SaaS, but you need to understand why it is happening. If it’s because of the end of a discount, it’s not real expansion, don’t fool yourself. Also, make sure with your Customer Experience team that this behavior is expected. They have either changed the plan or expanded the number of seats or billable events, so make sure it doesn’t come as a surprise to the client.
Contraction: yellow light here, the customer is paying less. It may be a seasonal issue that has nothing to do with the relationship with the solution, but the CX manager for that account needs to get on top of that. It can be the first quantitative sign the company gets (from this data source) that a customer may be in danger of churn.
Churn: a churned client is one that had at least one active subscription in the previous month and currently does not. A client can have an MRR of 0€ but remain with an active subscription (personal belief) and therefore not be considered as churn. Again, you need to be honest when considering churn. You need to review every single month the casualties with the CX management.
Churn is the most important metric in SaaS. Any SaaS with high churn will eventually dieNon-converted: to me, as I explained earlier, a client is an entity that is willing to pay and use your solution. As you know, SaaS has to be implemented, and that takes time and effort from both the provider and the client. If a company makes the decision, but the implementation fails for whatever reason, then, it never becomes a client. This happens more often than you think. So imagine you sign a big deal and after three months, the champion (your implementation lead inside your client) gets replaced by someone else who doesn’t think it’s the time for that implementation. You can consider that as churn or what I call a non-converted account. In my opinion, that never became a client so it should be removed from the Masterfile, while of course, it needs to be stored in a non-converted list.
Here comes the big controversy. As you remove a line from the Masterfile, you are modifying the number of new customers and actual customers you reported last month. To me, that’s the best way to go as long as you are open about it. It’s not gonna be a huge difference (in which case you have a problem), but you need to disclose this criterion. Now let’s keep in mind this happens because you may have a contract signed on the last hour of the month and you create a subscription, but later on you realize it’s not a client.
Note: try not to share your Masterfile with anyone unless it’s strictly necessary. That contains very valuable information. If you have to share it, make sure it’s anonymized and only disclose names when a DD (Due Diligence) is in place with the proper legal protection (that you know may not be enough).
In a separate post, I’ll be sharing my learnings on cohort analysis, which is so important it is what motivated the logo of this publication (art created by Marcos Medina).
SAMBA: the most important report for sustainable growth.
Why Samba? Formerly the S&M report (Sales And Marketing), I learned from a friend that over at VW had a report called SAMBA, so I made it match. It comprises all the GTM (Go To Market) efforts of the company or group of companies. So regardless of the number of entities you operate, you want to know how much it costs for you to acquire a new customer, and how can you do it more or more efficiently.
Before getting deeper into it, let’s refresh the different stages of customer acquisition, which you should be able to obtain for optimal reporting:
Contact: a person inside of a company. At this stage, you may not know anything about this person.
Lead: It is a contact related to a company that you know how you have acquired. You still don’t know if it fits your ICP (Ideal Customer Profile) so you need to enrich this lead indirectly or actively via an SDR (Sales Development Representative).
Deal: when you prove a genuine interest in the solution offered, a lead becomes a deal. A deal can also be in different situations: negotiating terms, resolving objections, pending demos to additional members…, but I’m keeping it simple.
Client: a customer is a deal that agrees to use and pay for your solution. Jackpot!
The SAMBA feeds from these data sources: accounting (PL), the CRM, and the back office:
From accounting, you need the investment made for each commercial effort. For that reason, you need your accounting software and processes to recognize each expense in the right analytical bucket. A bucket is the minimal and unique set of expenses you need to move a prospect across the sales funnel. For example, imagine you have a blog you use for capturing leads. All the expenses related to that blog would go into that bucket: the writer’s cost, the hosting, any tools or resources used… If a blog is used for many products/markets or whatever classification you deem necessary, you need to establish a way to split those costs with the use of an inductor. An inductor is a variable that reflects the effort. For instance, below you can find a case where a company incurs 4 different expenses for the blog in English language for a specific month. You see a total cost of 1.585€ that you distribute with an inductor. Then you obtain the cost of acquiring inbound leads for each market.

From the CRM or marketing automation tool you will need to obtain the number of leads, deals, and new customers you obtain every month. Following the previous example, let’s say you acquired 45 leads for the US market. Then you will see that the cost per lead is 14€ (634€/45 leads). Now imagine you get 40 leads for the UK, then the lead cost for the UK will be 12€. That’s when you can start comparing. You do the same for deals and customers and you have made yourself a report that allows you to see where you are more efficient and where you are not, and then try different things. Now bear in mind that deals and customers need to have included all costs incurred in previous stages, don’t fool yourself. Also, it’s good not to go crazy with the inductors, as it’ll be impossible to get exact, you need to find a good balance that’s representative enough.
From the Back Office, you need to at least have your ID. It may not seem relevant, but having a unique identifier for every single Client, lead, and deal…. is important. Remember that an email is not a valid ID.
In future posts, I’ll talk about specific metrics, but the ultimate metric on SaaS is Payback. Payback, besides a not-so-good movie, stands for the period that you need to recover the acquisition investment and it’s calculated by dividing the CAC (Cost of Acquisition per Customer) by the ARPU (Average Revenue per Customer). I say ARPU even though I’m not talking about users because in another life I was Italian, and we Italians cannot end a word without a vowel.
Please add your comments on what I have missed, what you disagree with, or what you’d like to read in a future post.